DiOwner — Your entire hotel portfolio, in the palm of your hand
Revenue, ADR, RevPAR, occupancy and receivables for every property and the whole portfolio — read in real time from the AI hotel management software, on one standardised set of metrics. No more every property reporting its own way.
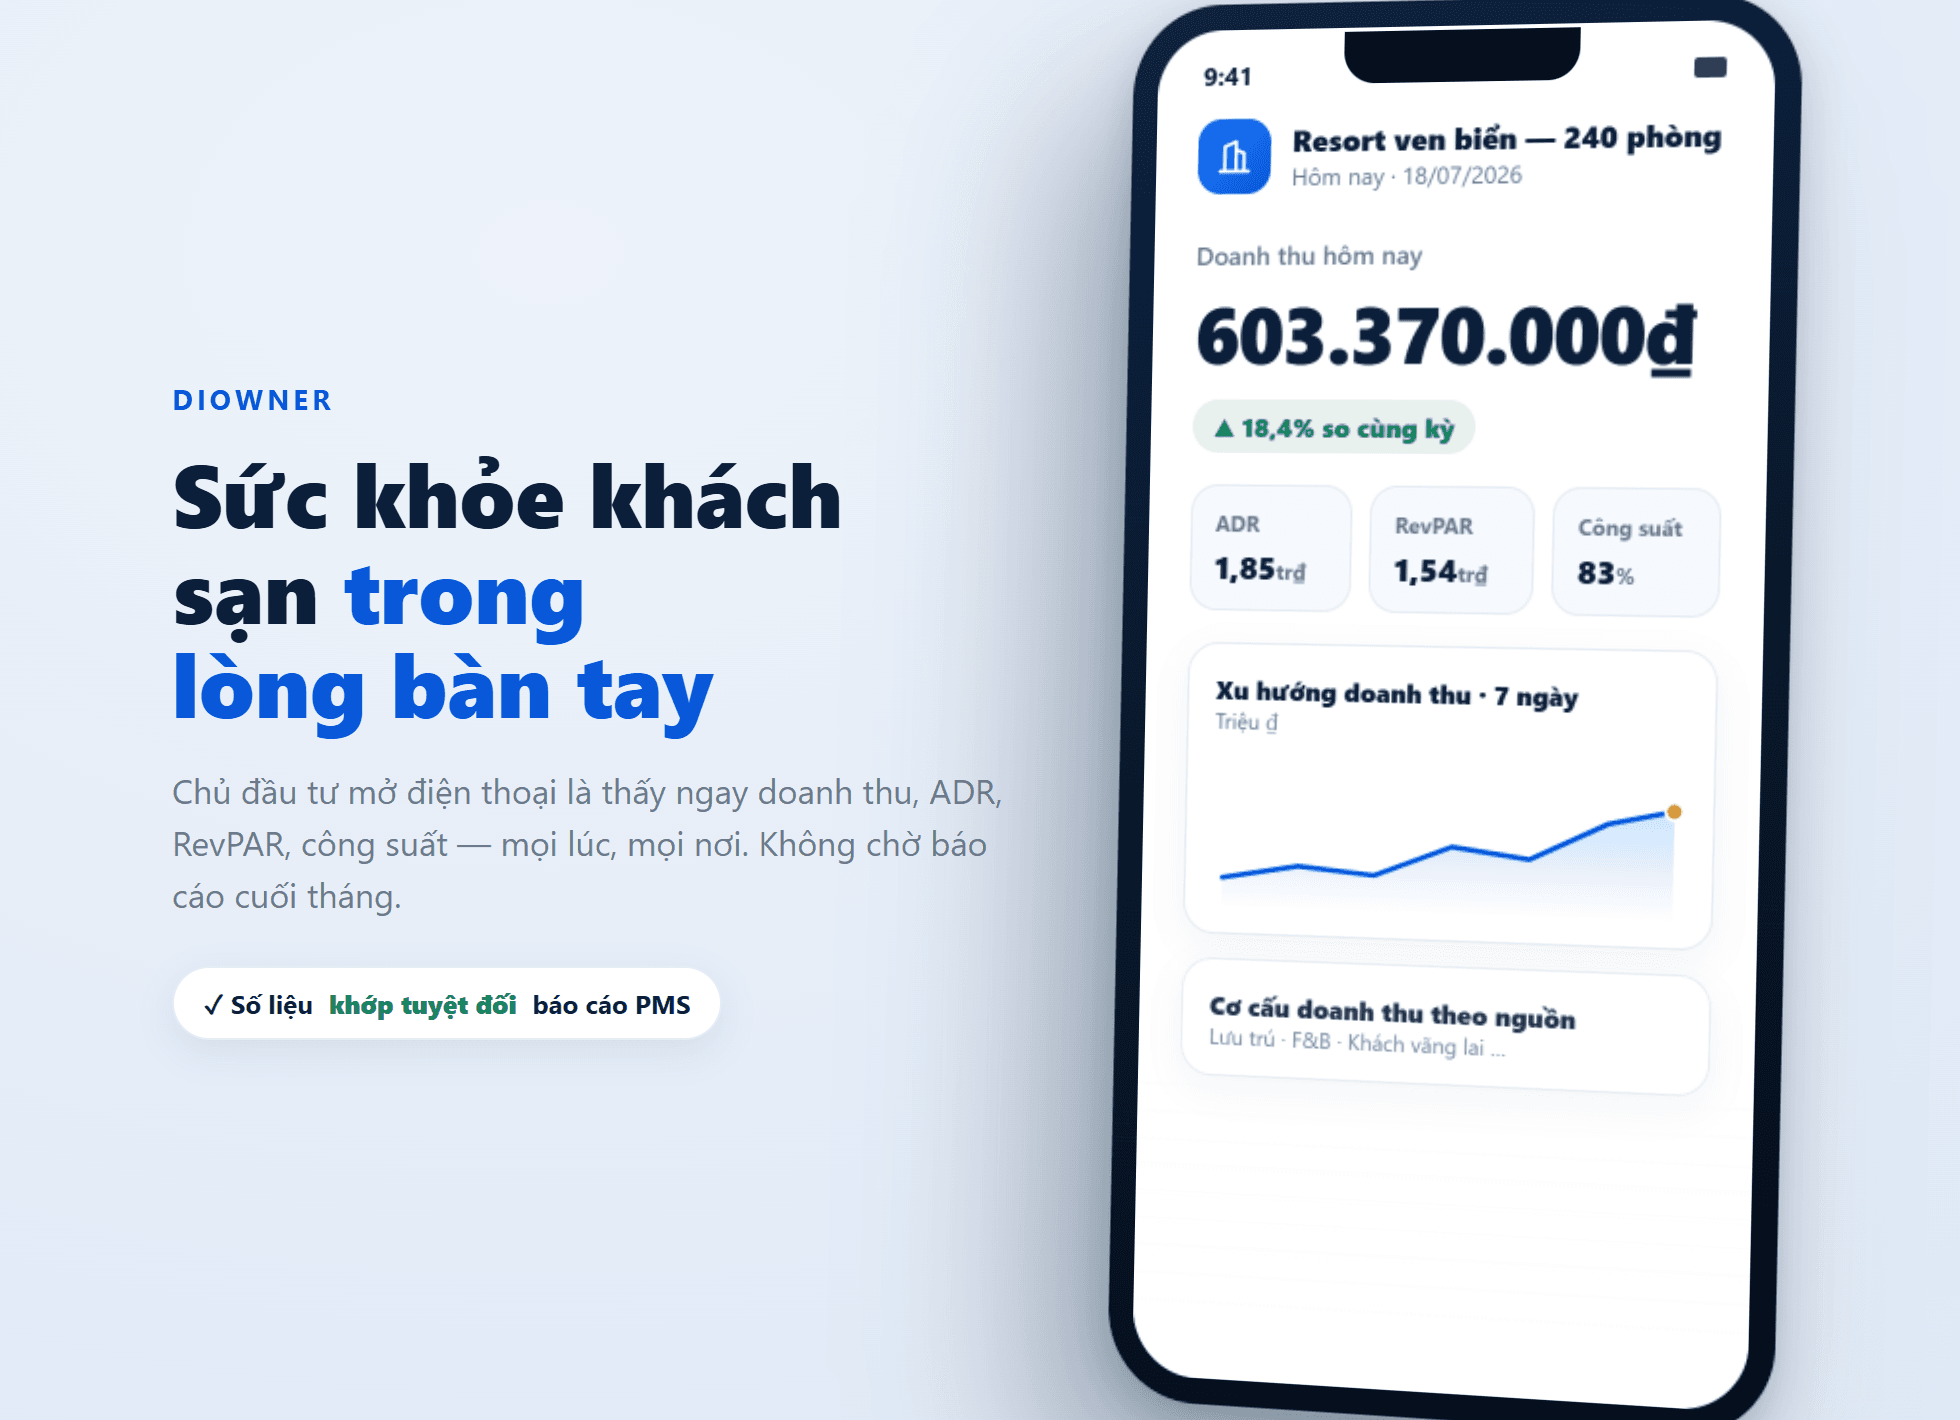
The five numbers that decide a hotel portfolio
By day, week, month and year — per property and consolidated across the portfolio, always with same-period comparison.
Net revenue, before VATActual average daily rate — showing where each property's price positioning sits relative to the rest of the chain.
Based on net revenueThe metric that combines rate and occupancy — the only measure that compares properties of different sizes and markets.
STR benchmark standardTrue fill rate, excluding out-of-order (OOO) rooms from the denominator so real selling capacity is never flattered.
Sum rooms first, then divideAmounts due from guests, travel agents and OTAs with ageing — a resort's cash flow depends heavily on this.
Labelled with accounting periodOne yardstick for every property — only then is it a comparison
When each property calculates its own metrics its own way, the consolidated table becomes a table of opinions. DiOwner takes numbers from the same system with the same formula — so the ranking reflects operating performance, not presentation style.
| Property | Occupancy | ADR | RevPAR | Room revenue/day |
|---|---|---|---|---|
| Beachfront resort · 240 rooms | 83% | 1.850.000₫ | 1.535.500₫ | 368.520.000₫ |
| Mountain retreat · 120 rooms | 71% | 1.680.000₫ | 1.192.800₫ | 143.136.000₫ |
| City hotel · 180 rooms | 78% | 1.420.000₫ | 1.107.600₫ | 199.368.000₫ |
| Whole portfolio · 540 rooms | 79% | 1.673.845₫ | 1.316.711₫ | 711.024.000₫ |
Illustrative figures. Note this: the mountain retreat has the lowest occupancy (71%) yet a higher RevPAR than the city hotel running at 78% — a gap of 85,200₫ per available room. Filling more rooms does not mean earning more money. This is the kind of conclusion that only appears when every property is measured by the same yardstick.
🧮 A small detail that decides everything: portfolio occupancy is 79% — calculated by summing occupied rooms and dividing by total available rooms. Taking the plain average of 83%, 71% and 78% gives 77.3%, off by 1.7 percentage points. That error scales with portfolio size, and it is one of the most common consolidation mistakes when reports are merged by hand.
Open your phone and it is there — even from overseas
A minimal interface with very fast response — open it and the numbers are there, no waiting for a report to load.
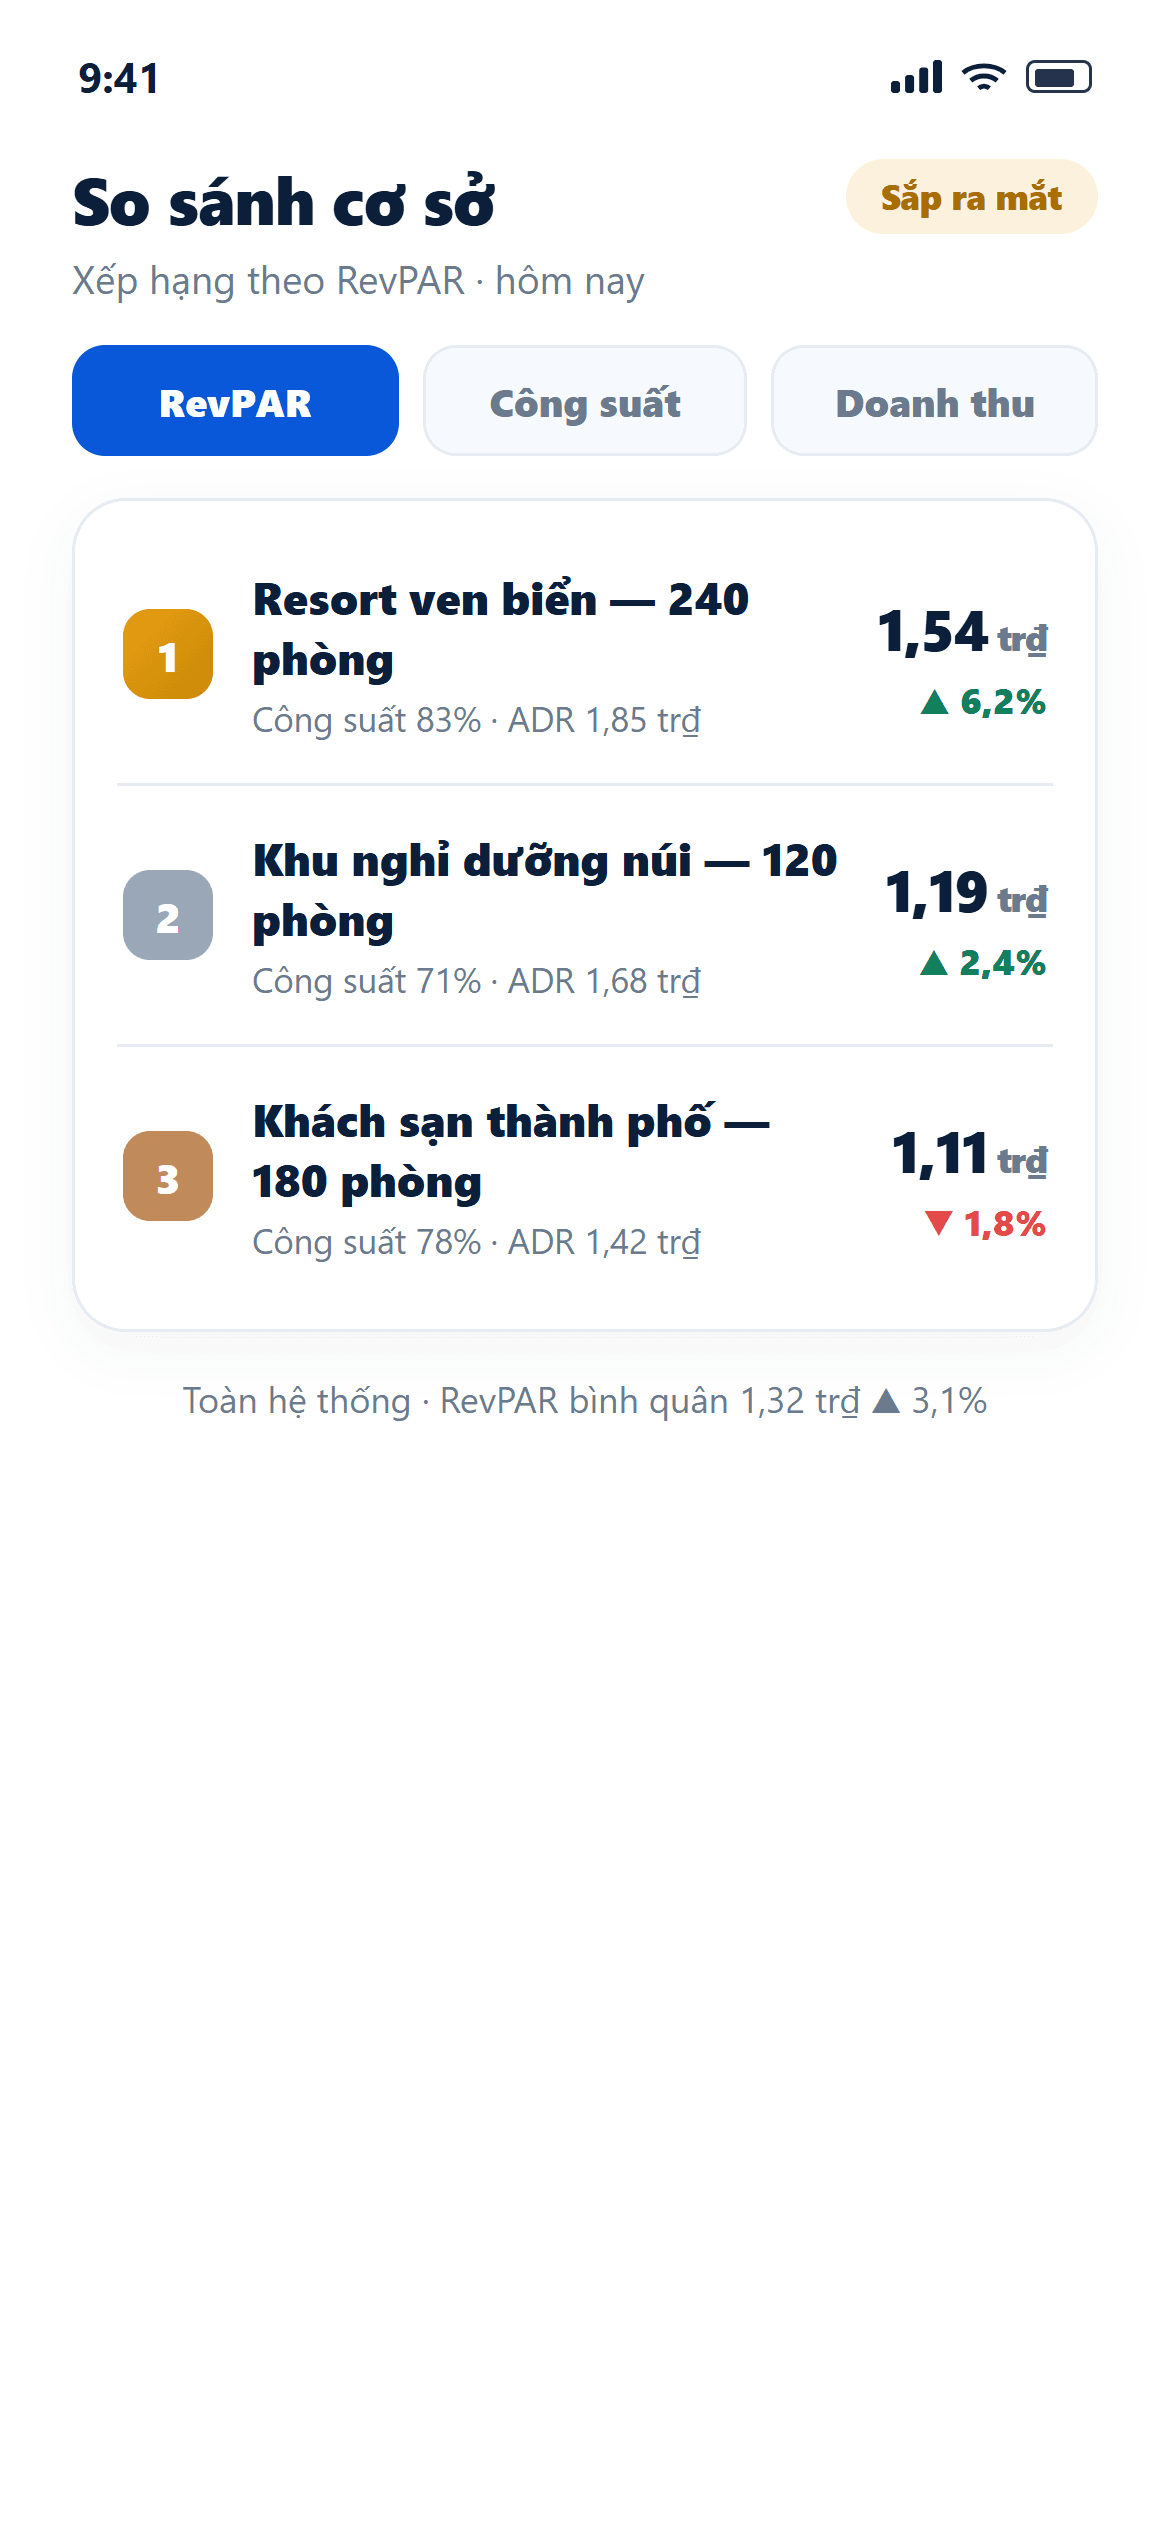
Rank properties by RevPAR, occupancy and revenue — see immediately which one is dragging the portfolio down.
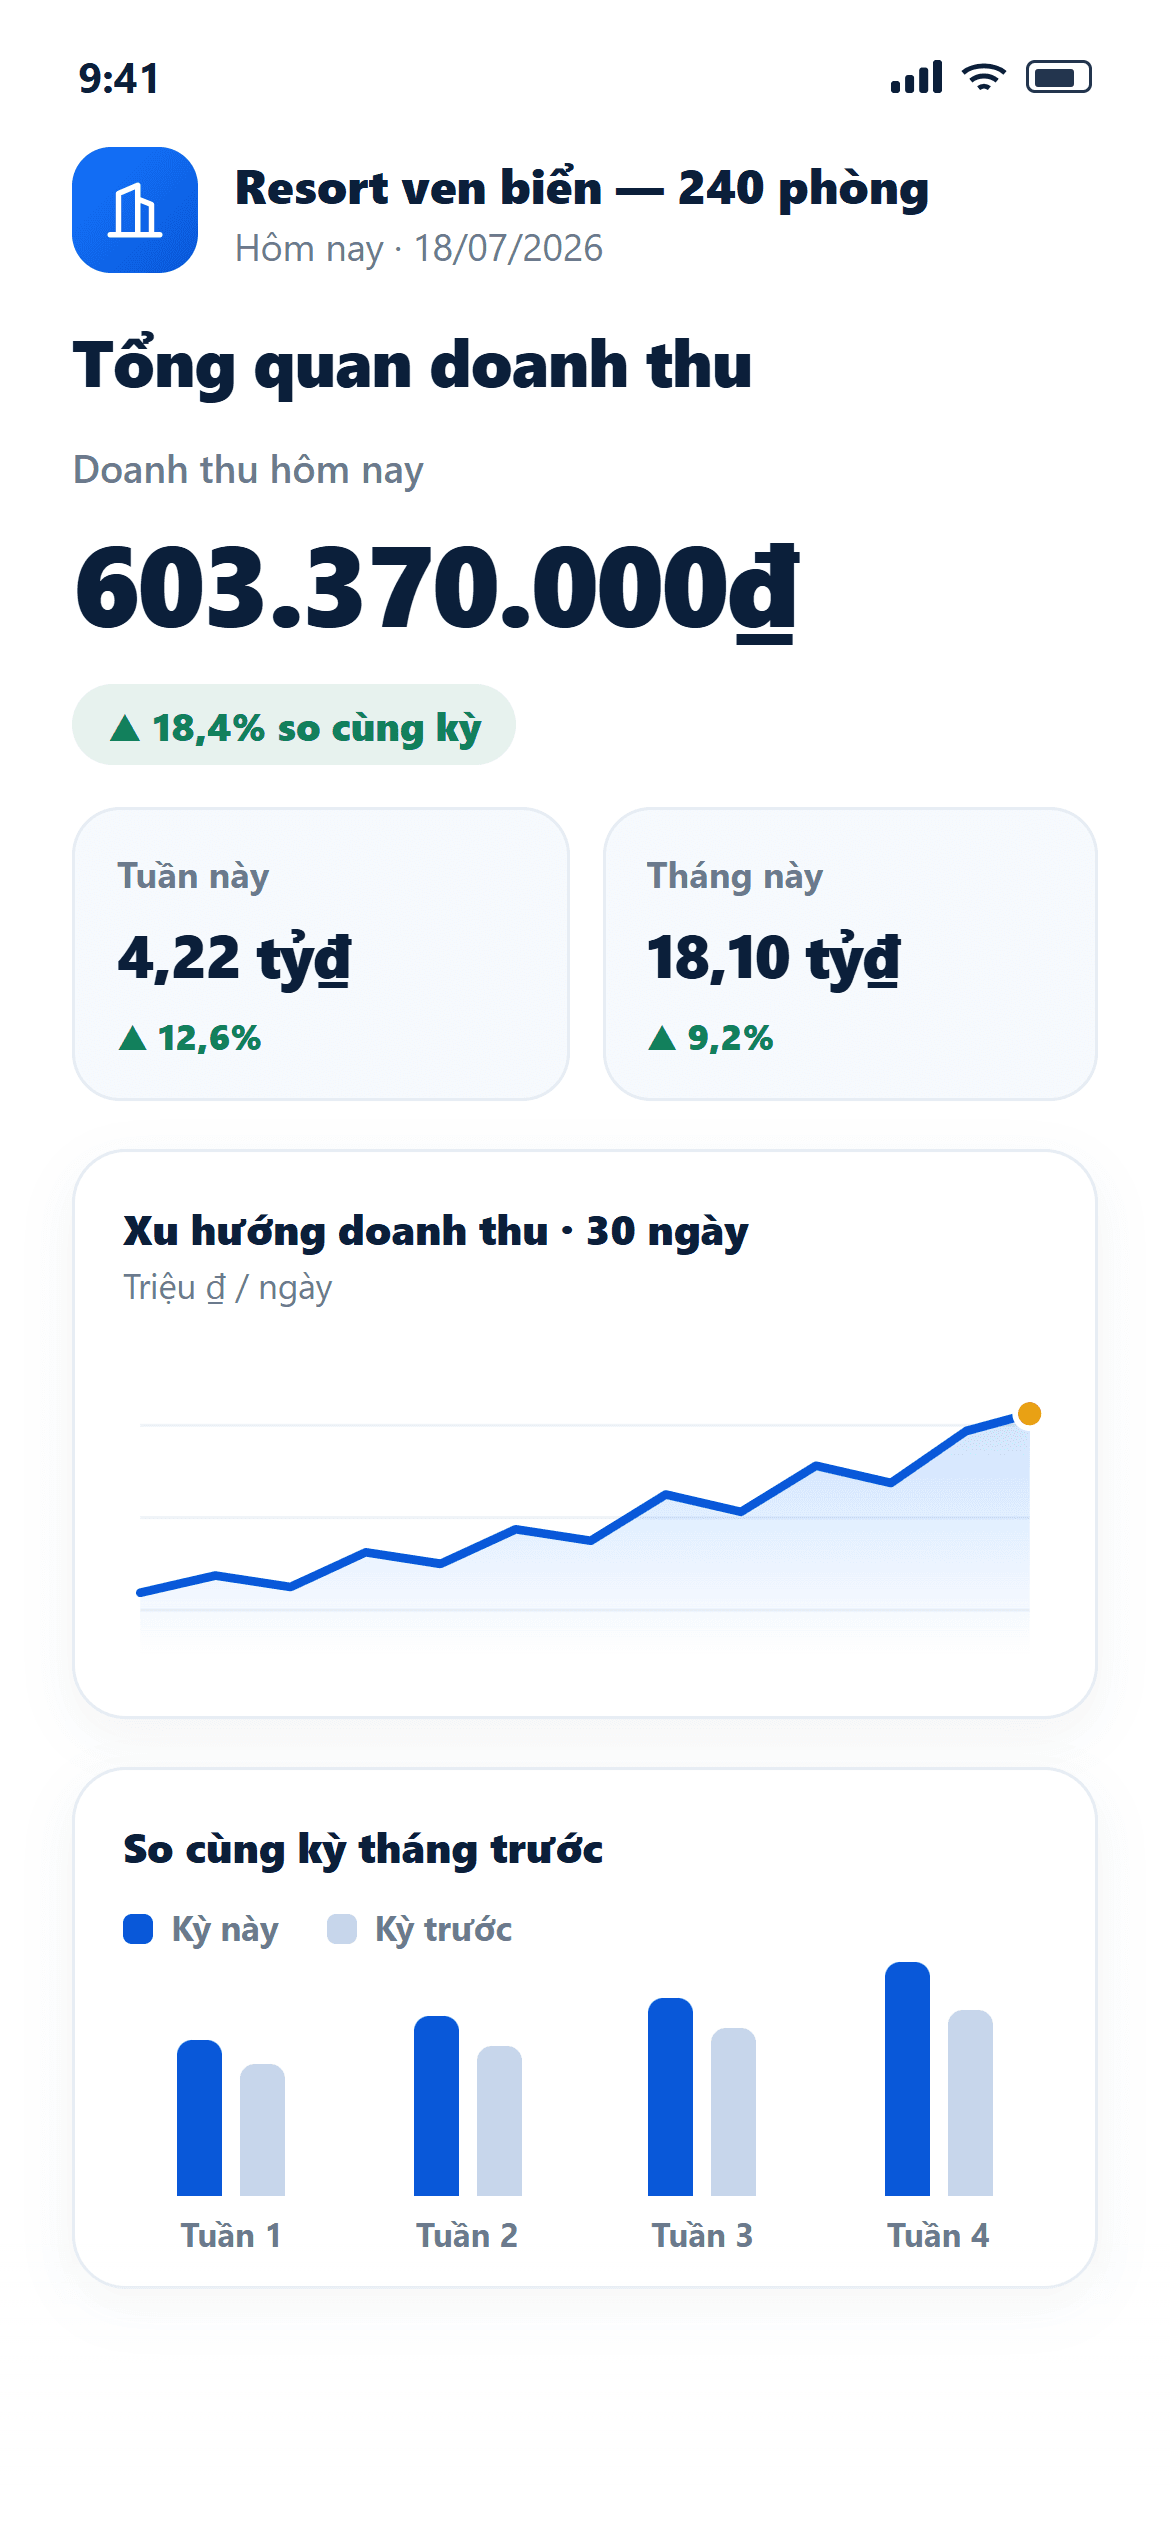
Total portfolio revenue and trend charts — no manual merging from multiple files.
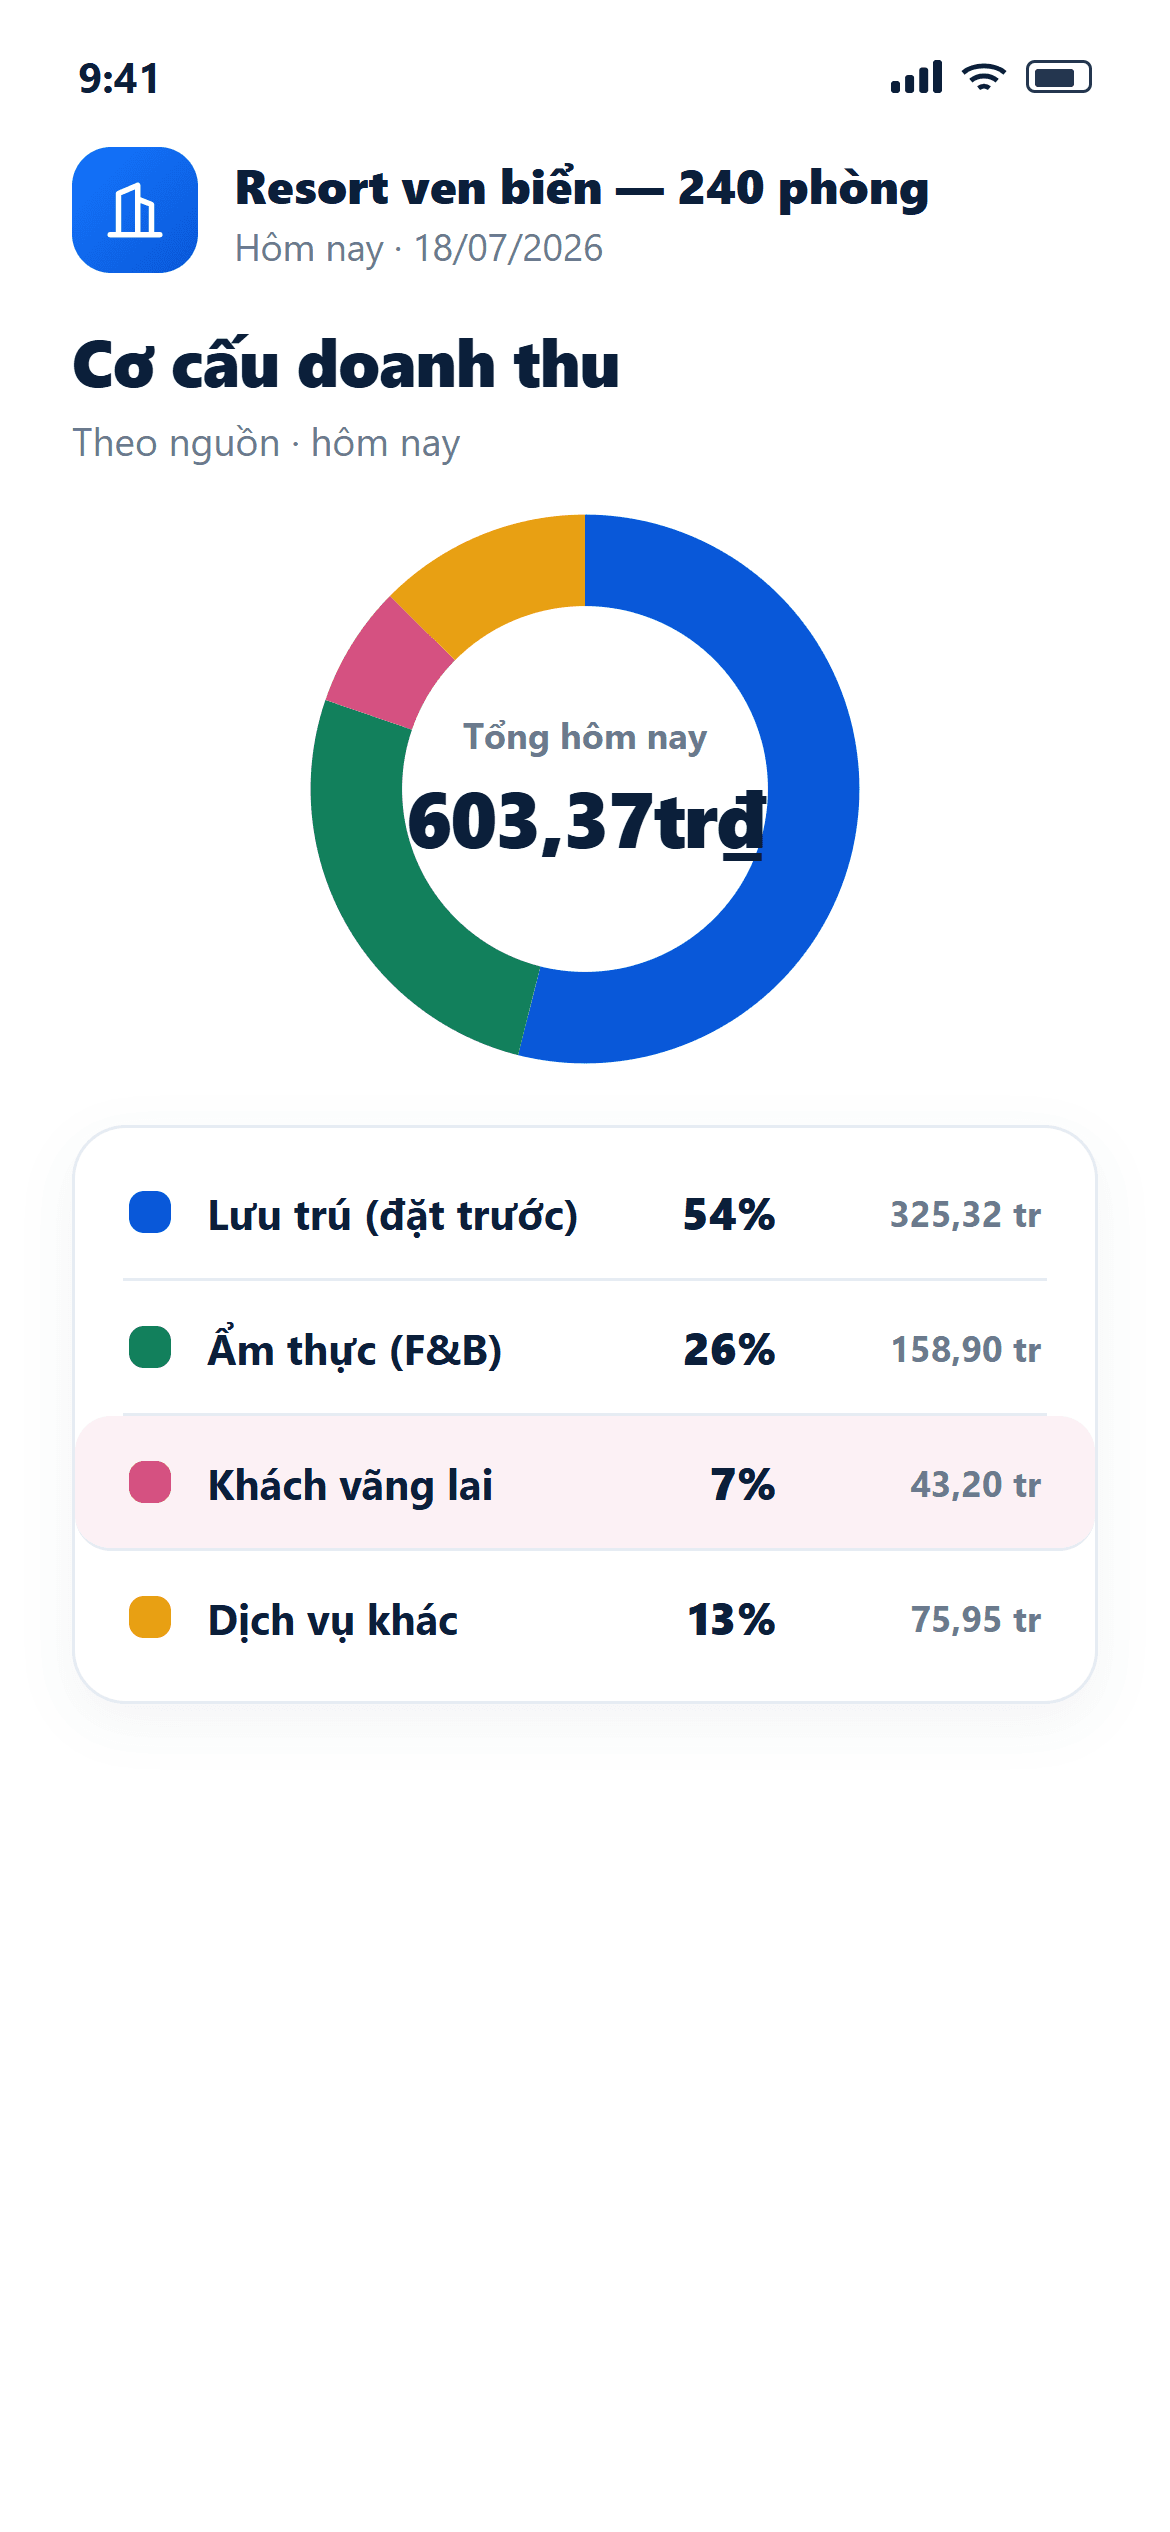
Rooms, F&B, spa, services and walk-in guests — at an F&B-strong resort, non-room revenue can be close to half the total.
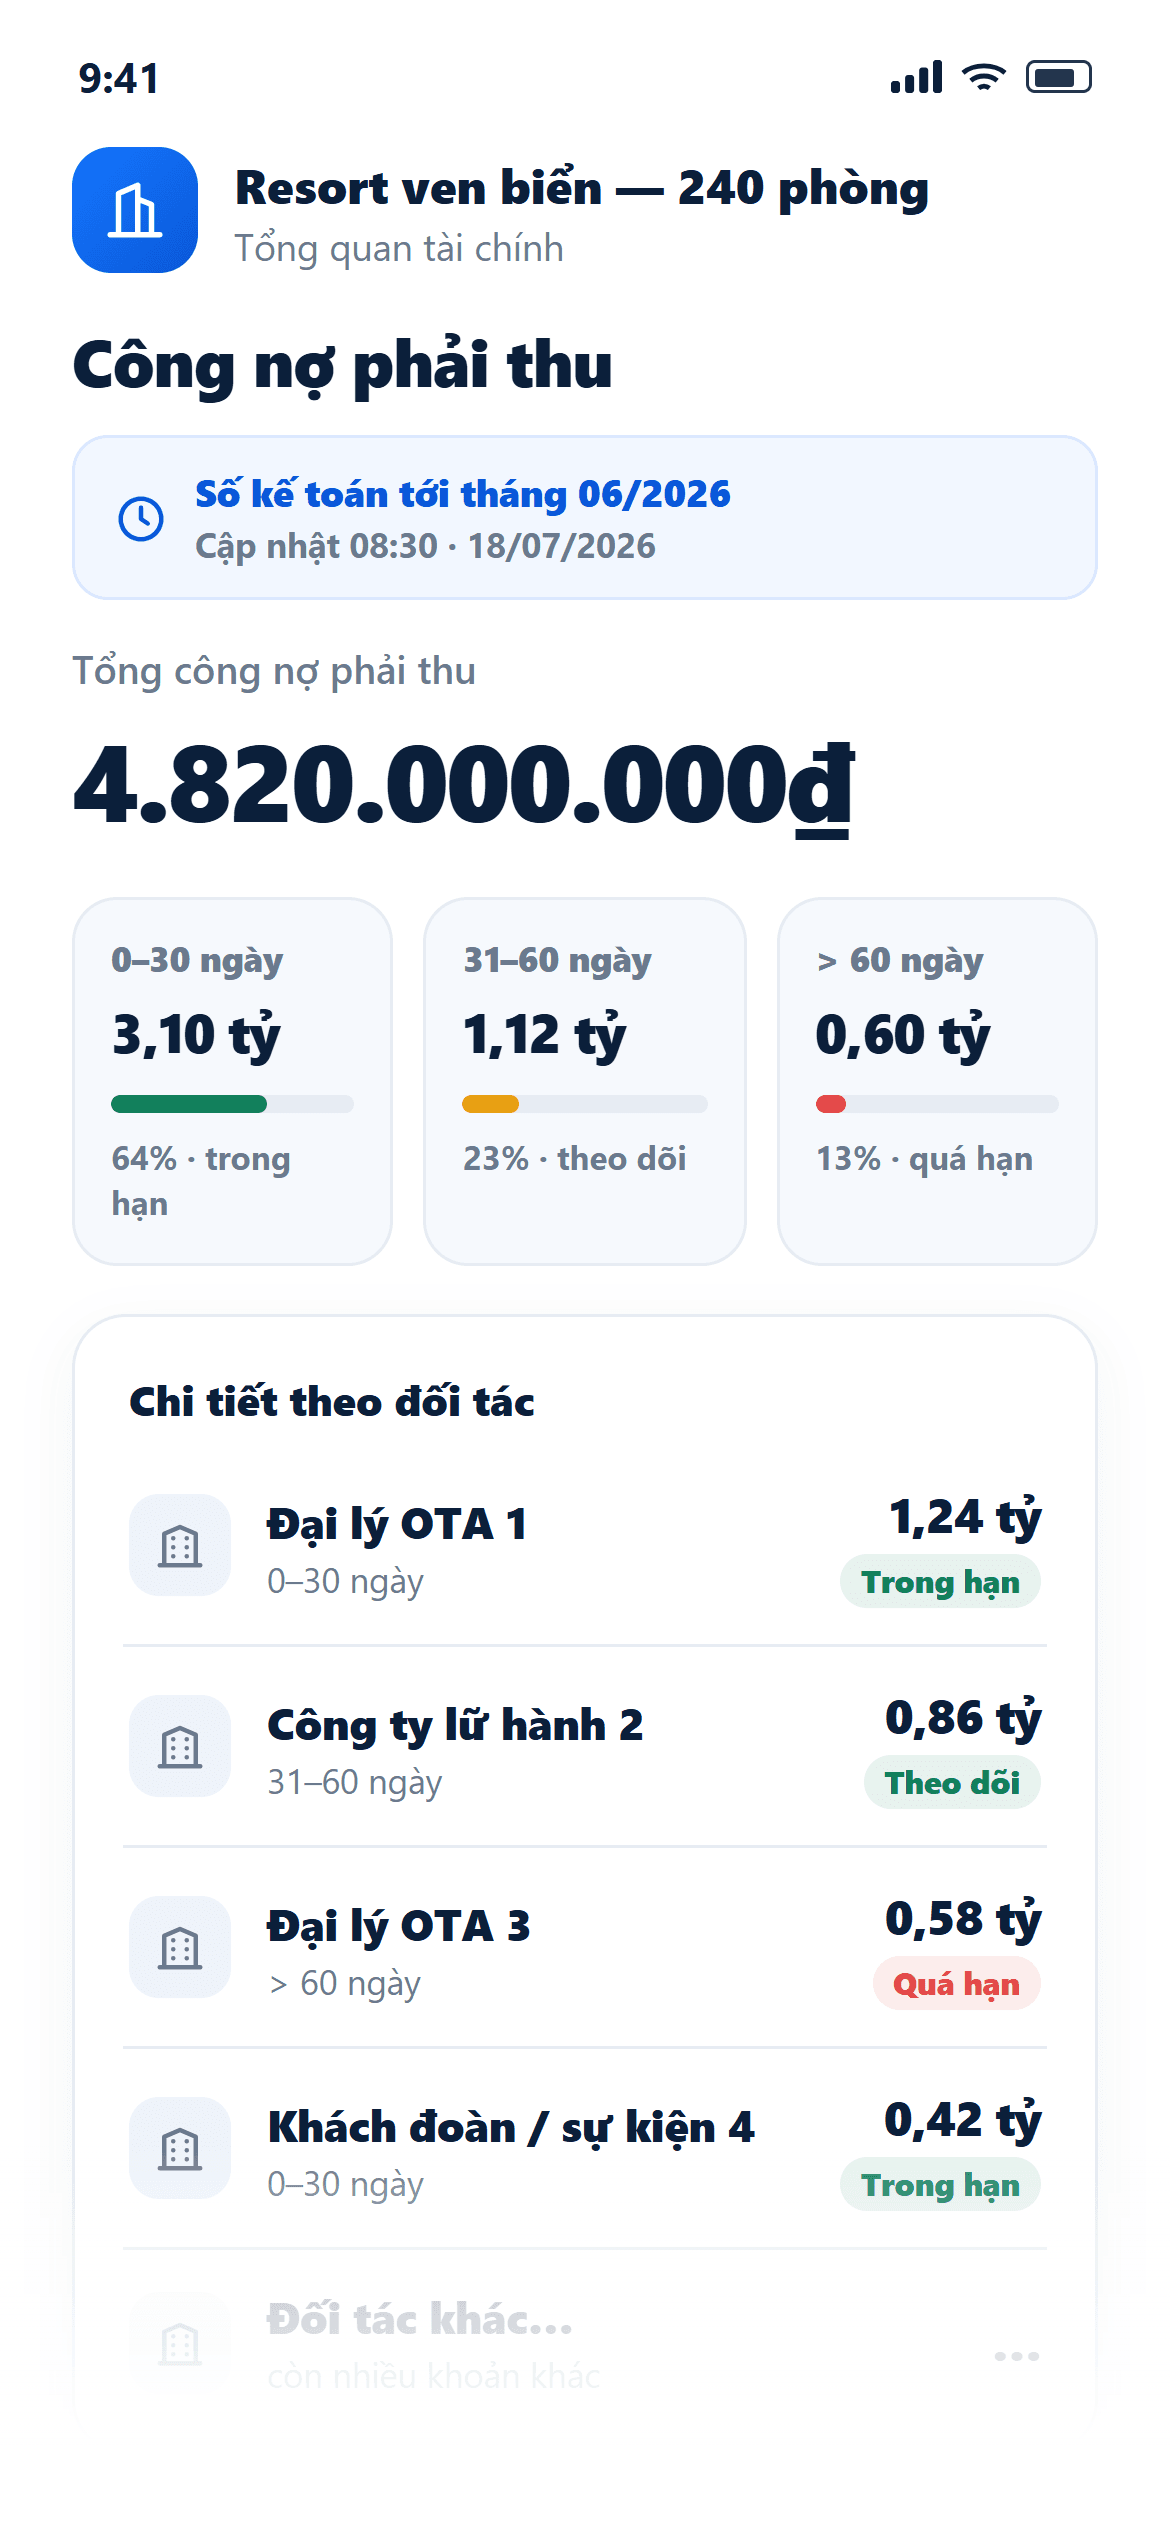
Which travel agency owes what and how far overdue — labelled with the accounting period already closed.
The numbers cannot be off by a single dong
At 4–5 star and group scale, a small calculation discrepancy multiplies into a large one once properties are consolidated — and it will be caught at audit. That is why DiOwner is built on a single principle: every metric must match the source report in the management system exactly — no rounding for looks, no estimating, no inference.
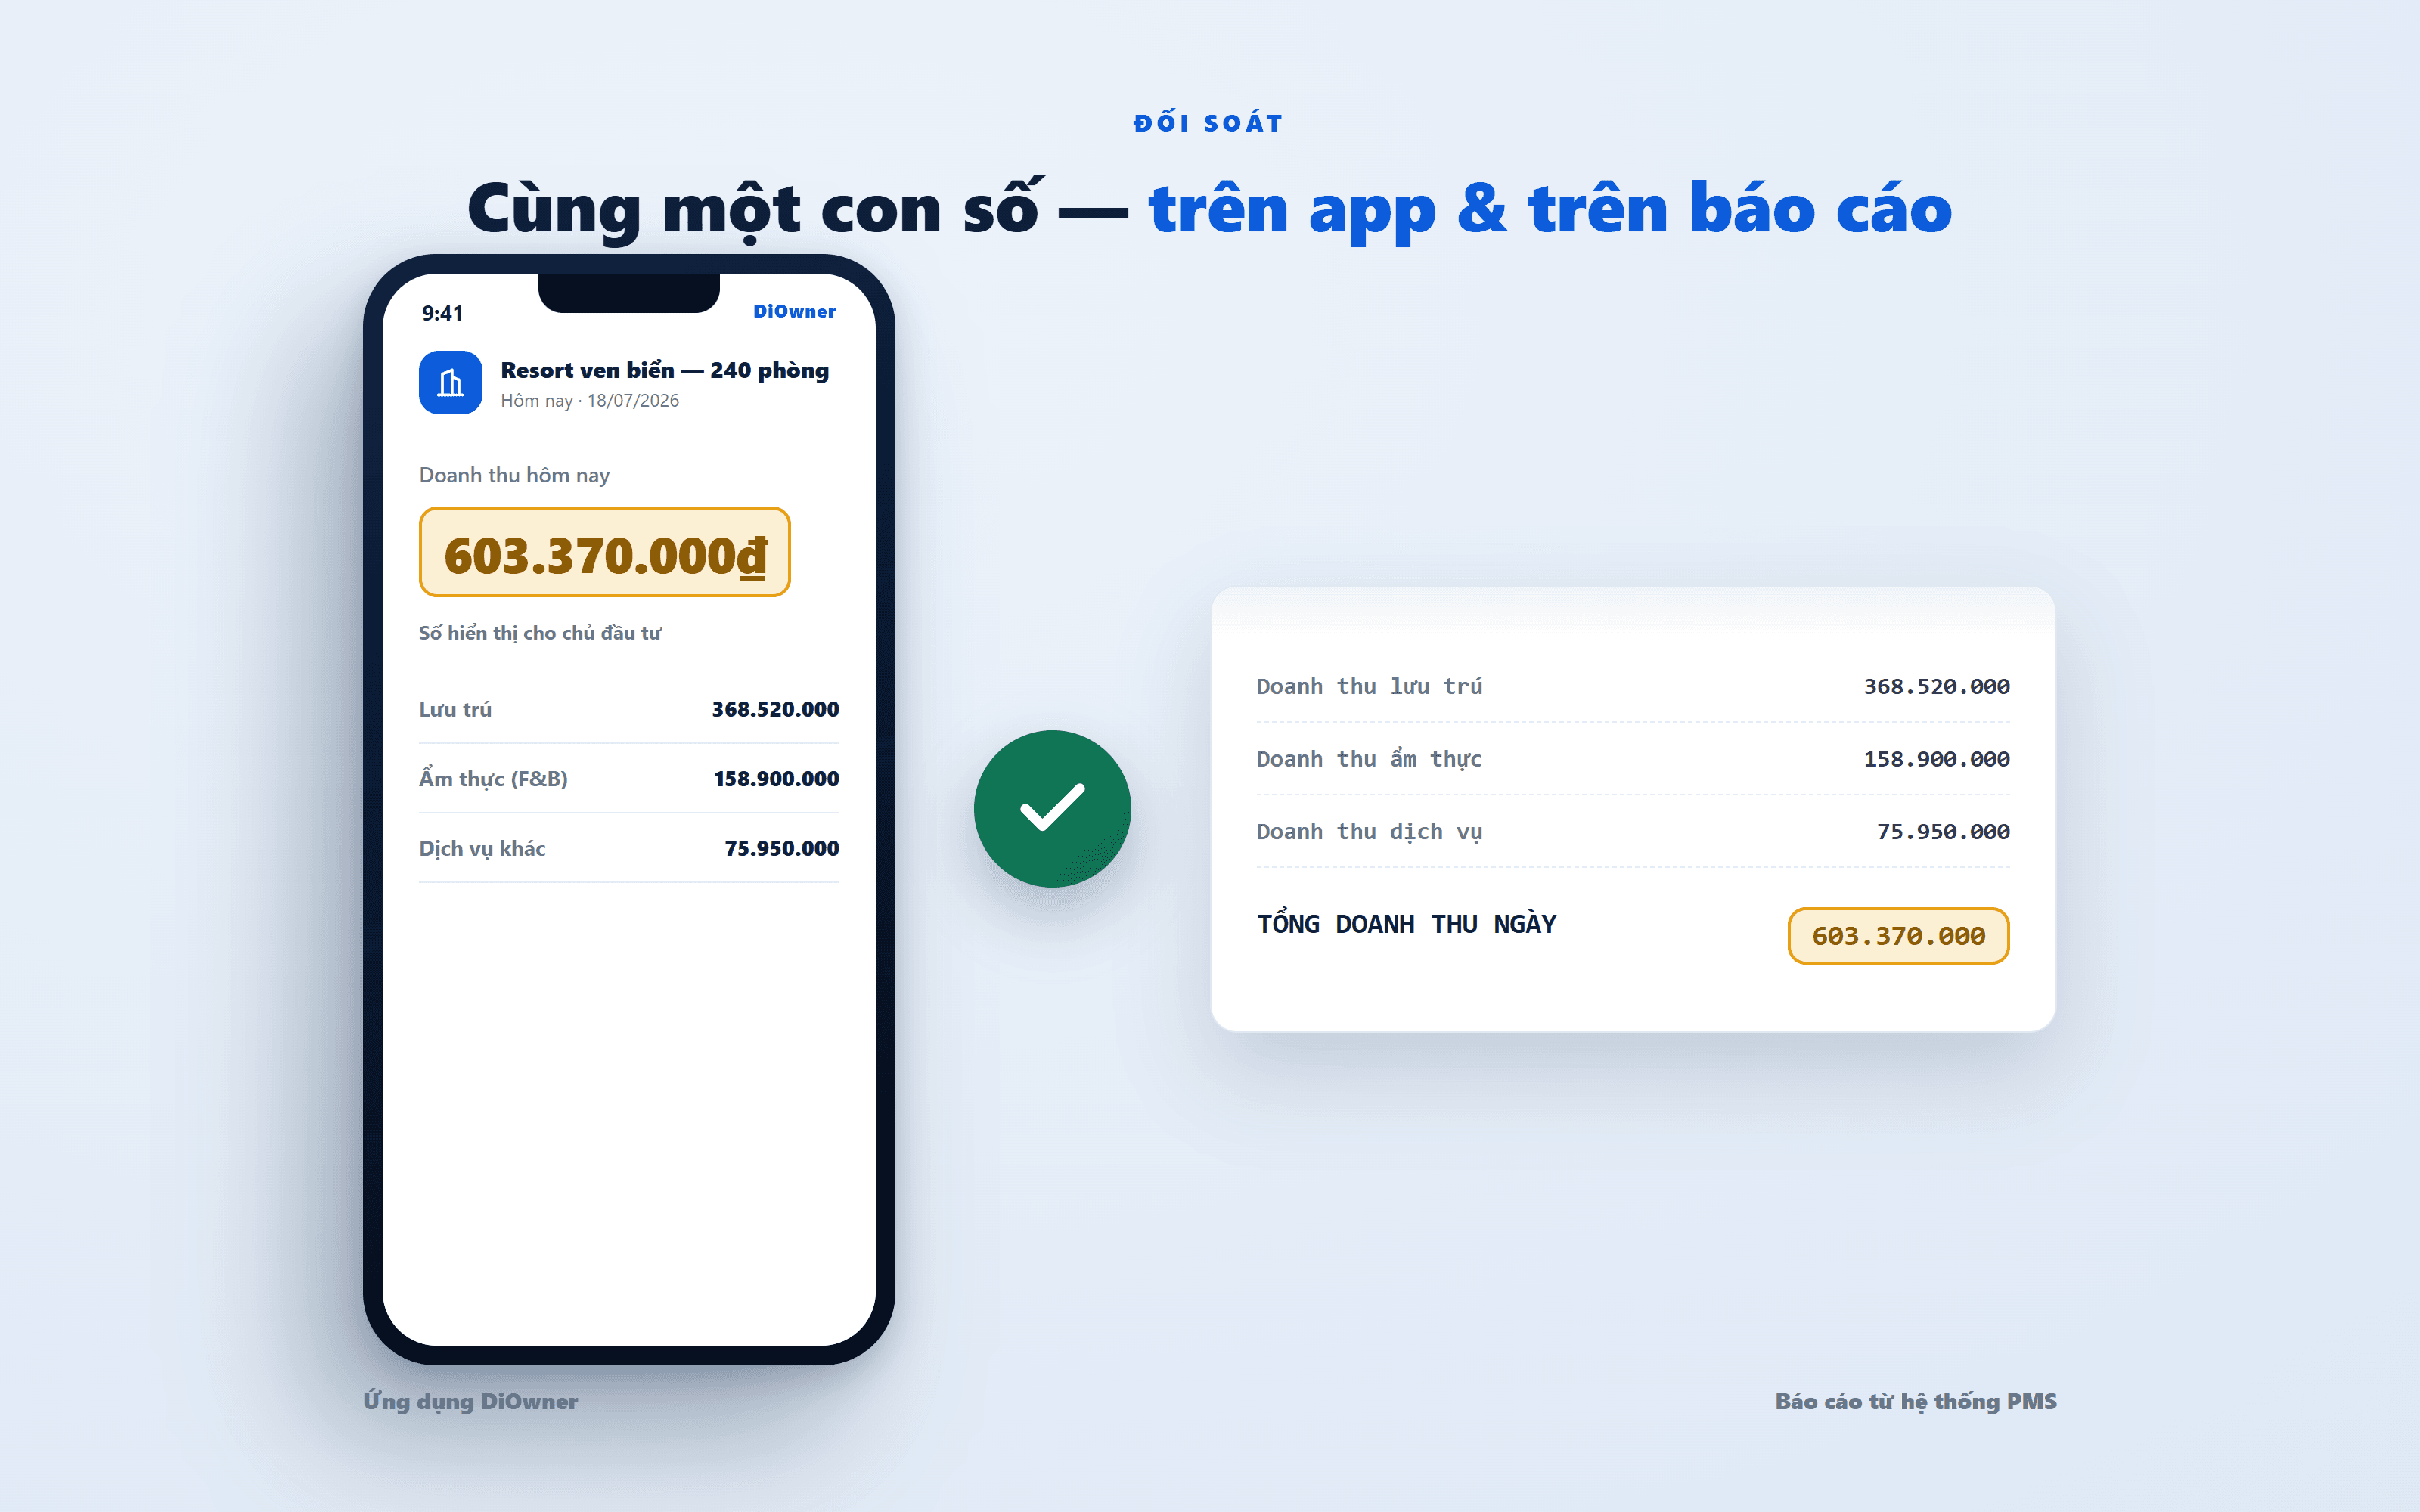
Same period, same number — reconciliation between DiOwner and the system source report.
All calculation happens in the management system layer. The app does no arithmetic of its own — so it cannot produce a number that differs from the source system or from the report submitted to audit.
Every metric is reconciled with the source report day by day on real hotel data until a full year matches — not a few sample days followed by a conclusion.
ADR and RevPAR are calculated on net revenue following USALI/STR practice — the basis for benchmarking against the market and for acceptance by international management brands.
Out-of-order (OOO) rooms leave the denominator, while rooms merely out of service stay in. Consolidating across a hotel means summing rooms before dividing — never averaging the percentages of each room type.
Complimentary and house-use rooms are excluded from revenue but still recorded as receivables. Charges already posted and not reversed remain revenue — even for a no-show.
Revenue is broken out by individual service line, not aggregated by total invoice — because folding breakfast into the room rate distorts ADR immediately.
⚖️ Transparent about lag: operational figures are real time, but accounting figures are closed by period. DiOwner always states "accounting figures through MM/yyyy" along with the update time — you know exactly how current what you are looking at is, instead of assuming everything is instant.
Anomalies come to you, no need to wait for a meeting
You set the thresholds per property. When one is breached, a push notification goes straight to your phone — while there is still time to act.
A property falls below the percentage you set versus the same period — you know that day, not at the monthly report.
An early warning so you can adjust rates or open more room allotment to distribution channels in time.
A partner exceeds the allowed number of days — a reminder before the debt becomes hard to collect.
High-value cancellations or discounts beyond authority — transparency that protects both owner and management team.

Alerts pushed straight to your phone the moment any property breaches a threshold.
Know the next period, not just the last one
Every traditional report talks about the past. But an owner's decisions — whether to open more allotment to travel agents, whether to adjust rates for the coming season, whether there is enough demand to reopen a closed facility — are all decisions about the future.
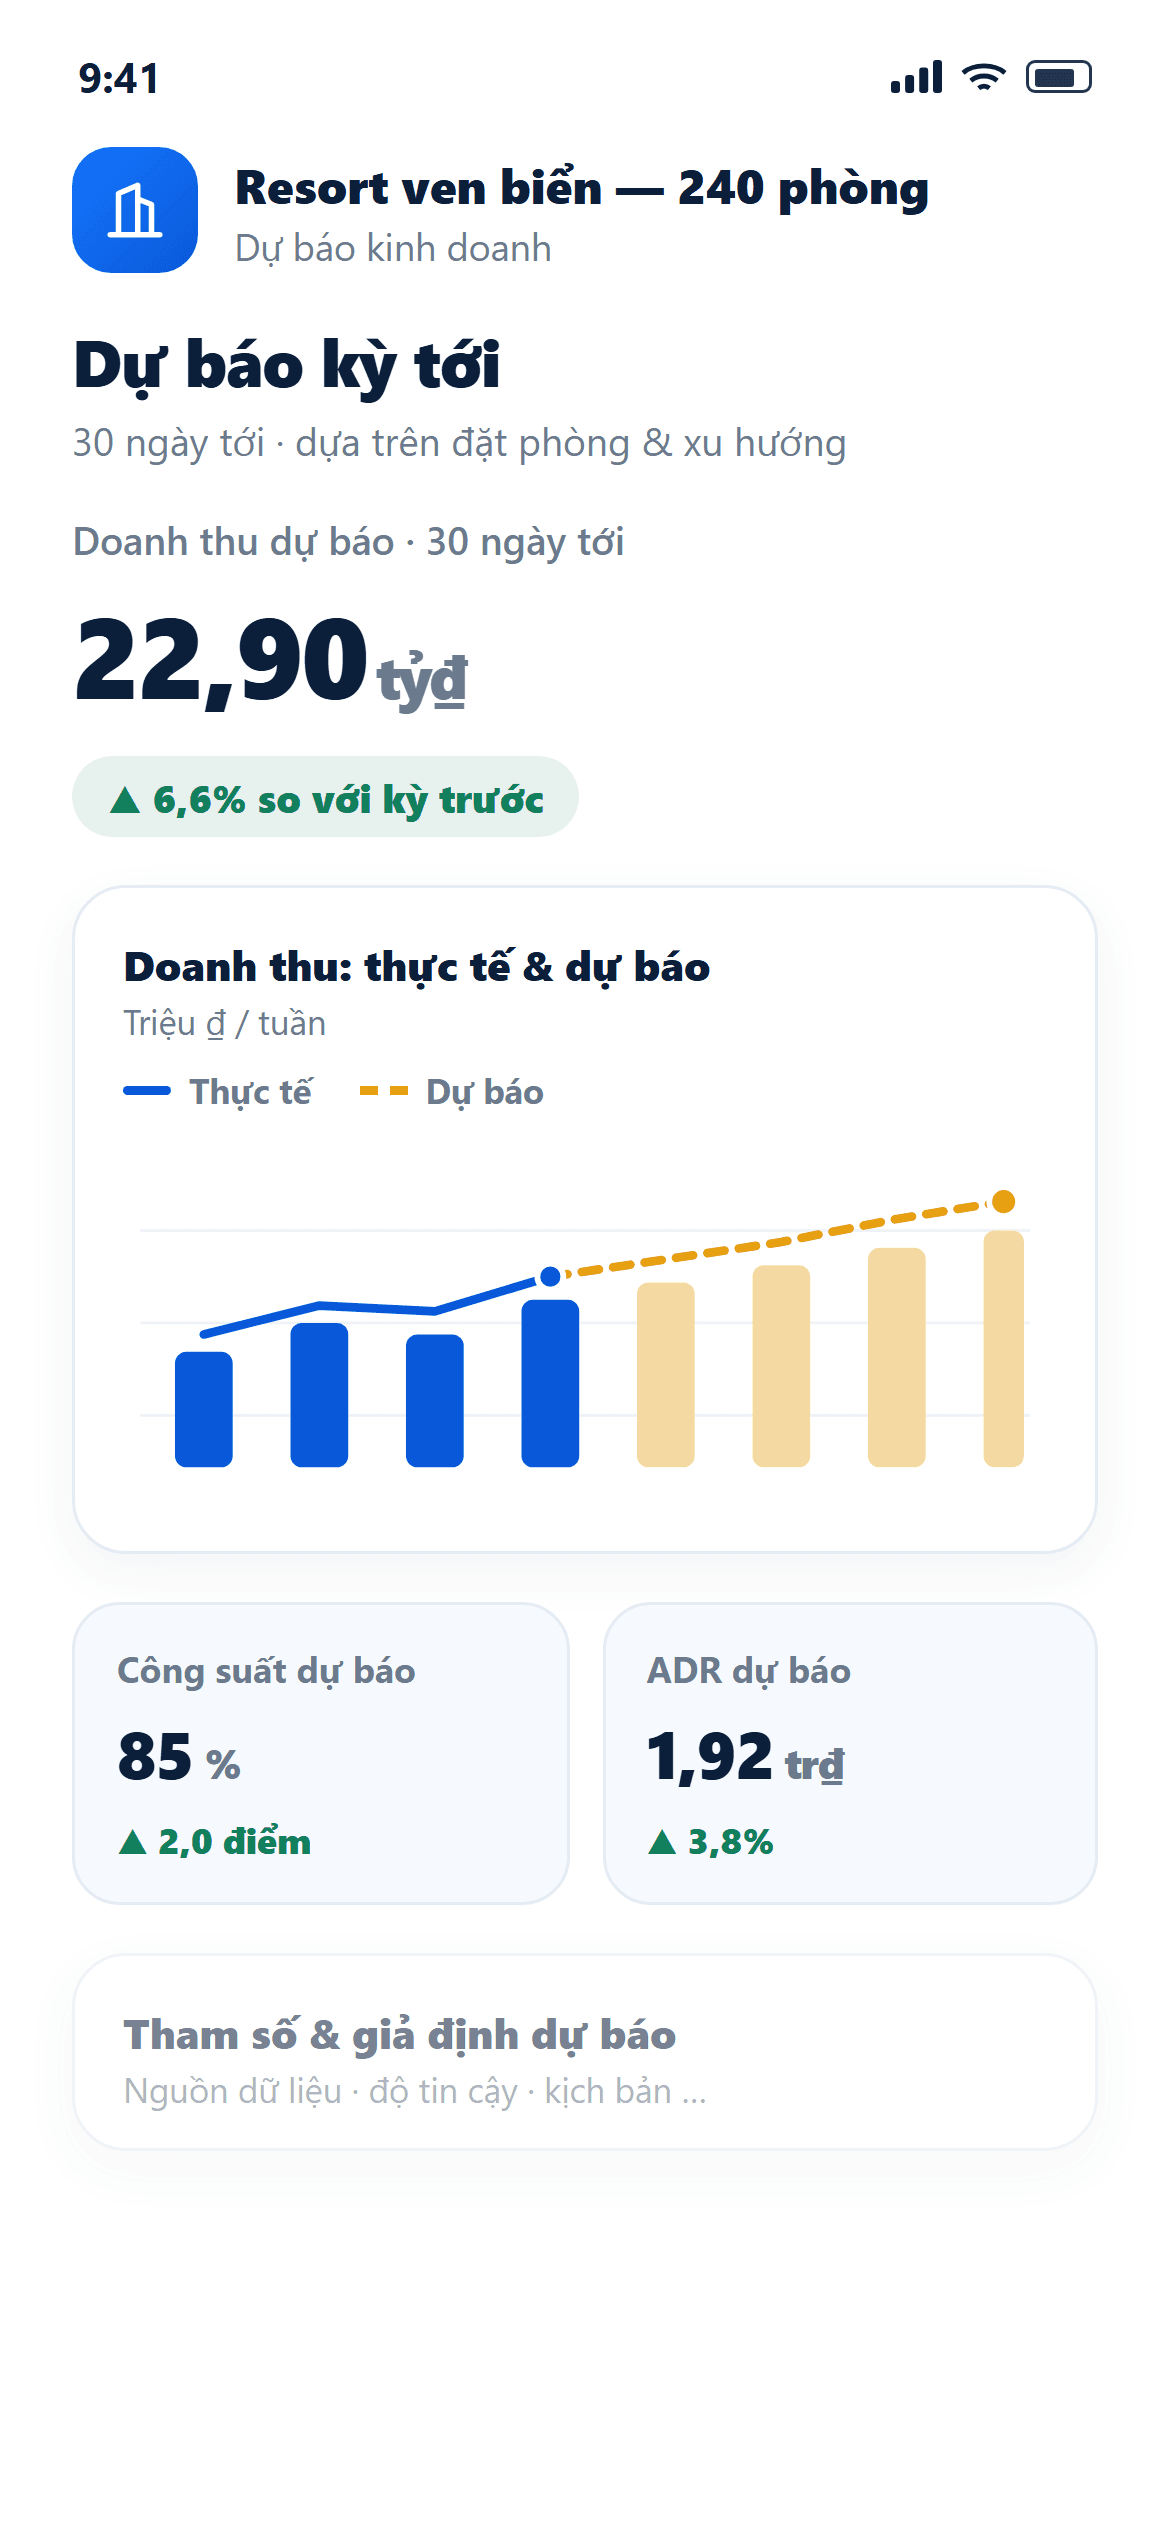
DiOwner provides forecast reports with a 30, 60 and 90 day horizon per property (or any custom date range), based on rooms already booked (on-the-books) — real reservations already in the system, not guesswork.
To be clear: this is a forecast based on actual booking data, not an artificial intelligence prediction model. We describe it for what it is — because a forecast number is only worth something when you know where it came from.
Who sees what — down to each property
Every metric for their own hotel, anytime, anywhere.
The whole portfolio, each property in detail, and cross comparison on standardised metrics.
Only the properties they hold a stake in — transparency with partners without opening the whole system.
The consolidated picture for meetings and capital allocation decisions.
🔒 All access is read only — DiOwner cannot edit operational data, so it never affects the hotel's daily operations.
Fingerprint or face — financial data is the most sensitive kind, so it does not stop at a password.
Data is encrypted in transit and at rest; every access is logged for internal audit.
Sessions can be revoked remotely — a lost device does not mean lost data.
Serving both domestic owners and Japanese partners — a market DiHotel Solutions has worked in for over 20 years.
You invest in AI for your hotel — but where do you measure the return?
Owners are pouring more money into AI: booking chatbots, operational automation, seasonal rate optimisation. But the final question is always the hardest — how much money did that investment actually bring back? DiOwner is where owners see the answer, in numbers.
DiChatbot — the AI booking assistant already live — takes bookings via website, Zalo and Messenger straight into the system, with no intermediary commission.
The 5-star hotel management system records every dong of revenue against the correct source and formula, with nothing mixed up and nothing missed.
DiOwner shows revenue by channel — exactly how much the AI-driven direct channel contributes versus intermediaries. This is the piece that lets an investment in AI hotel management software prove its value in numbers rather than impressions.
🧠 A truth few people state: AI in hospitality is only as strong as the data feeding it. A forecast model running on figures that fold breakfast into the room rate will produce the wrong rate recommendation — and produce it very convincingly. That is why DiOwner puts accuracy of the numbers ahead of any flashy feature.
The foundation today, intelligent analytics tomorrow
Revenue, ADR, RevPAR, occupancy and receivables — per property and consolidated across the portfolio.
Push notifications when any property breaches the threshold you set.
Forecasting from rooms already booked (on-the-books) — seeing the next period instead of only reviewing the last. Not guesswork: the basis is real reservations already in the system.
The profitability metric owners care about most. It ships only once operating costs are fully recorded — publishing a shaky profit figure early is worse than not having one.
Identifying suspicious deviations on its own rather than only comparing against fixed thresholds.
Why we started with accuracy rather than features: the hardest part of a financial reporting app is not drawing beautiful charts — it is guaranteeing every number matches the source system exactly, to a standard fit for audit. That hard part is finished and verified on real hotel data. Every layer of intelligent analytics above is built on that foundation, for one simple reason: running AI on wrong numbers is more dangerous than not using AI at all — it makes you confidently go the wrong way.
DiOwner is only as good as the system producing the numbers
This is what we want to say honestly to owners: a reporting app does not create good data by itself. If the system underneath folds breakfast into the room rate, misses walk-in revenue or fails to separate complimentary rooms, every beautiful chart above is meaningless — and you will allocate capital based on a false picture.
For 4–5 star hotels, resorts and multi-property groups. See the premium hotel management software.
For small hotels, boutiques and mini chains within the same portfolio. See DiCloud AI cloud hotel management software.
Many owners hold both large resorts and small properties. DiOwner reads from both systems to the same standard — consolidated on one screen.
Our partner